Tutorials
Below are examples on how to use surface_plot

Tutorial 04: Plot of statistical maps with two thresholds
Tutorial 04: Plot of statistical maps with two thresholds

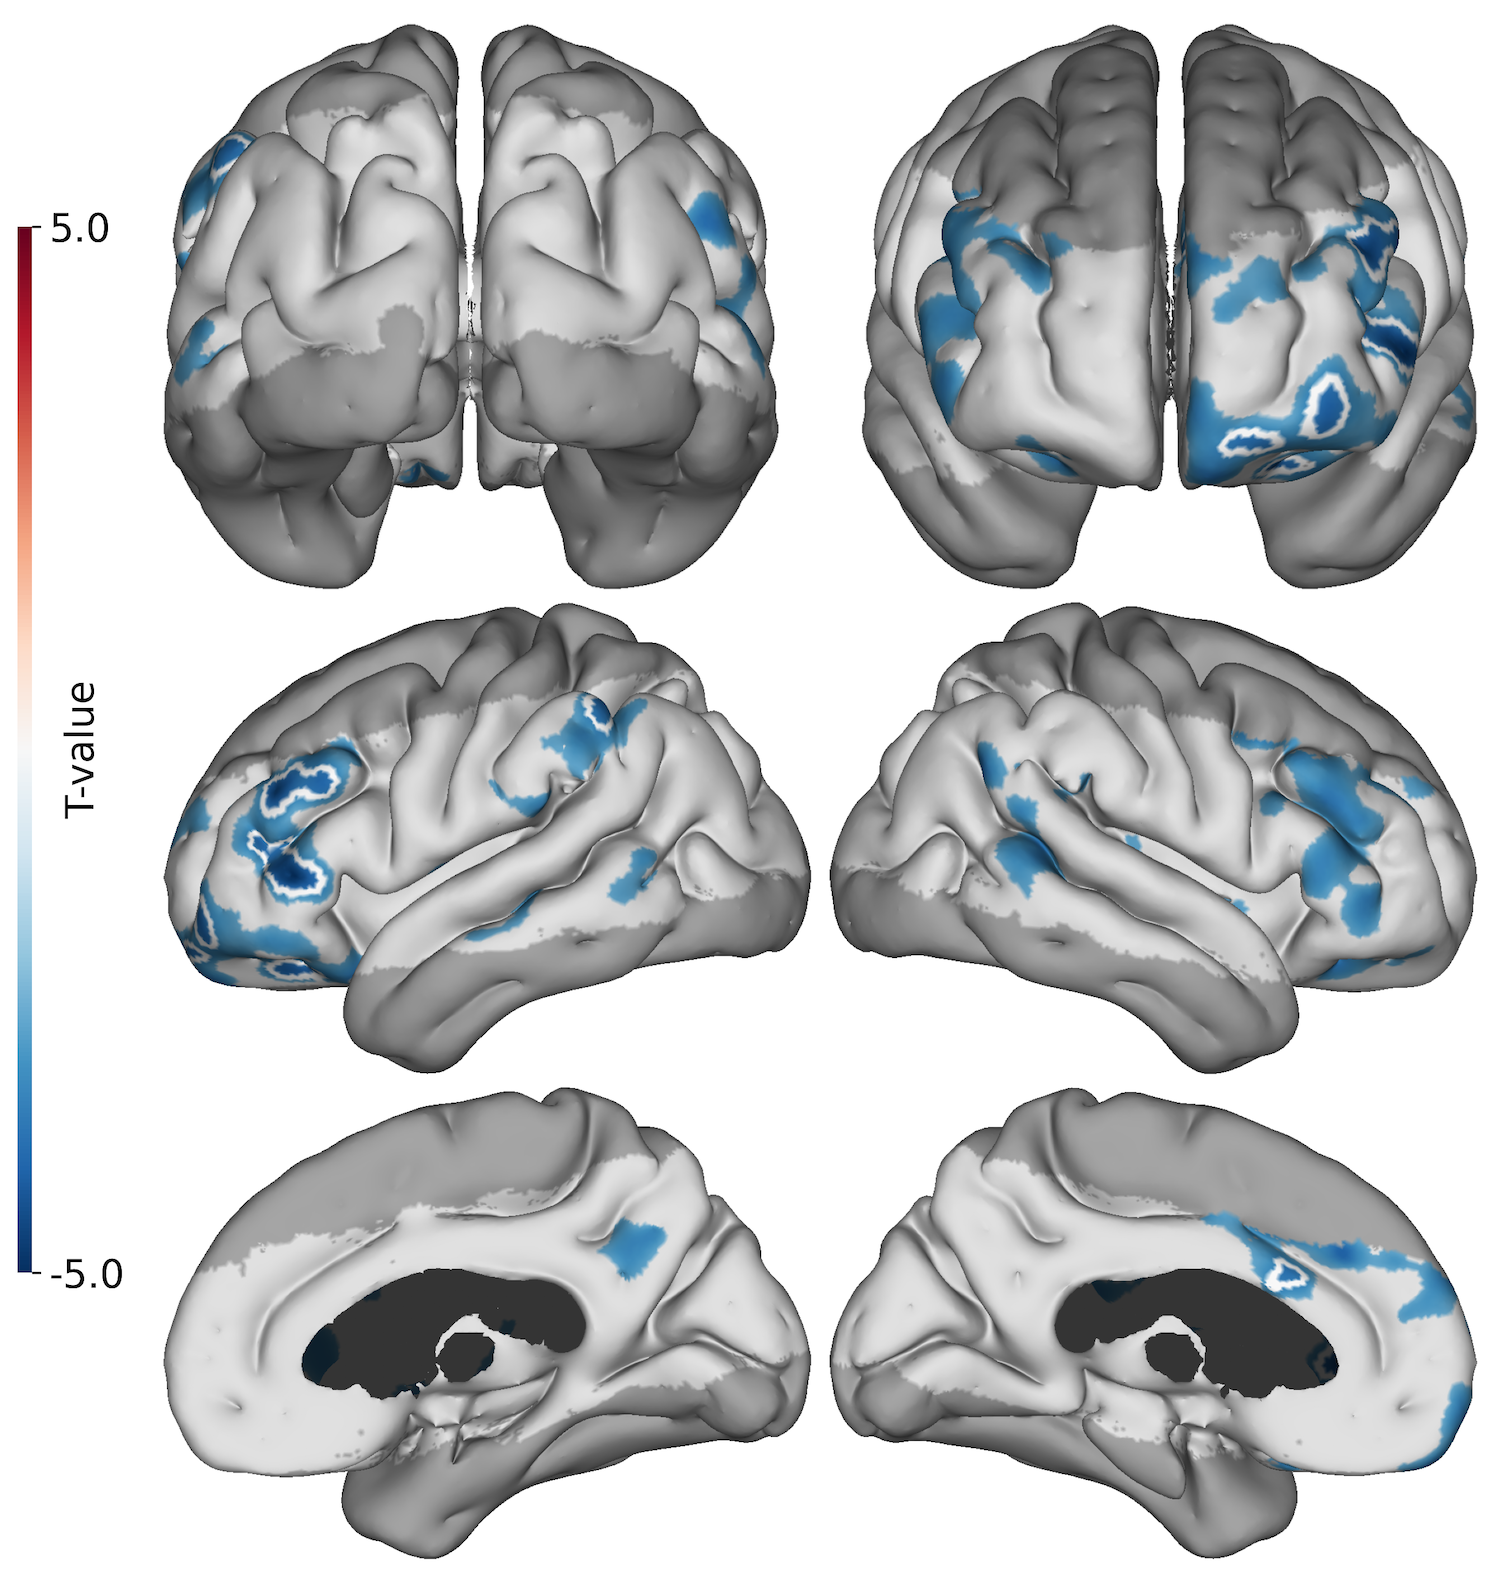
Tutorial 03: Plot of mean and statistical data (t-test)
Tutorial 03: Plot of mean and statistical data (t-test)
